| Jens Altmann | |||
Operation of JSIM-51 |
JSIM51 is a powerful tool for software development with 8051-controllers and its derivatives. The program simulates the processor kernel and some of the hardware functions. I wrote it because all commercial products are too expensive for private users. Obviously, as for all freeware, there is no guarantee for the correct function in all cases. But I'll try to fix all bugs which I'll get reported as fast as possible. The following text explains the most important functions and the operation of this program.
Table of Contents |
| Notes for loading SDC51/ASxxxLink - Projects |
Downloads |
| jsim_e.zip | English version V4.05 for Win32 from 01/08/2000 | 285 kB | ||
| jsim.zip | German version V4.05 for Win32 from 01/03/2000 | 286 kB | ||
| 8051.zip | DLL for simulation of a standard-8051, V1.017 - 09/17/1999 | 122 kB | ||
| 80320.zip | DLL for simulation of a 80320 - Dallas, V1.019 - 10/03/2000 | 112 kB | ||
| jsimdoc.zip | Updated documentation in English and German, HTML | 143 kB | ||
| jsim.pdf | Original documentation in German, PDF | 81 kB | ||
| omf51.exe | OMF-51 specification in English, MS-Word | 43 kB | ||
| Unfortunately I've no time for further support of the program. So if anybody wants to have anything changed, he must do it himself. Here are the sources. I would expect that useful changes will be made accessible for other people! | ||||
| coresrc30.zip | Latest sources for the core application | 374 kB | ||
| 8051src22.zip | Latest sources for the 8051-DLL | 53 kB | ||
| 80320src14.zip | Latest sources for the 80320-DLL | 60 kB | ||
| Here is a short project to test JSIM-51: | testprj.zip | (3 kB) | |
| List of fixed bugs | |||
| Here is the same description in German ! | |||
Overview |
This program simulates the processor kernel and some hardware functions of a 8051 controller. In this
way it's possible to test software parts independently of the target platform. The speed of this simulator reaches
(running on a Pentium 200) nearly that of an 8051 clocked with 10 MHz (in the best case without trace). I think this is
acceptable. The operation philosophy and user interface is designed as far as possible and sensible like
that from MS-VisualC++ 4.2.
You need the newest version of Comctl32.dll which comes with IE3!
Because the program is fairly complex, I expect to still find some bugs.
Due to bug fixing and improvements, the operation may differ from this manual.
To facilitate operation by the user, most elements of the interface have tooltips.
All windows can be docked in the main frame.
In this way the surface becomes more comfortable and orderly.
Because I was always disgruntled if a program used many DLLs and wrote something into the registry, I was
careful to avoid that. Till version 2.09 it was so. However, many people want to simulate different derivatives
of the 8051 or possibly other controllers with the same operation interface.
So I've divided the application into an EXE (jsim.exe) and at least one DLL
which contains the simulation program for a specific processor. Otherwise there are no changes.
There are no entries in the registry.
If you want to dispose the simulator,
simply delete jsim.exe, jsim.ini and the processor DLLs.
The settings of any project will be written into a file with the extension
".wsp" which is located in the project directory.
![]() The workspace files from version 3.0 are not compatible
with the older versions. Also workspace files created from the German
version may not work under the English version and vice versa.
Simply delete and recreate them.
The workspace files from version 3.0 are not compatible
with the older versions. Also workspace files created from the German
version may not work under the English version and vice versa.
Simply delete and recreate them.
If you want to know more about the internals of JSIM51, read this page (in German):
Hintergründe zum Programm und Implementierungshinweise
Select a Processor |
The processor which is to be simulated must be loaded as a DLL since version 3.00.
Do this with: File-Select processor->selection.
In the dialog you can select a processor or search for a DLL.
The available processor DLLs will be registered in "jsim.ini" and
are visible in the list. (At the first start you must search for the DLLs!)
The type of the selected processor will be noticed in the workspace file.
You must select only one time explicitly.
![]() If at the time of opening of a workspace a processor was loaded,
If at the time of opening of a workspace a processor was loaded,
it will be taken instead of the type in the workspace file!
Load a File |
JSIM can load the following file-formats:
![]() OMF-51Ext is supported only by the Keil-C51-compiler.
This file format should be preferred. It yields
more profit at debugging HLL-sources (distinction between
upper/lowercase of symbols, type definitions for complex data
types). I've tested the HLL-debugger with sources which were
compiled with the Keil-C51 compiler V3.40. By now the version 5.1
is available. I'm not sure if the debug information is always
represented in the same way. This simulator doesn't support bank
linked applications as the new compiler and linker.
OMF-51Ext is supported only by the Keil-C51-compiler.
This file format should be preferred. It yields
more profit at debugging HLL-sources (distinction between
upper/lowercase of symbols, type definitions for complex data
types). I've tested the HLL-debugger with sources which were
compiled with the Keil-C51 compiler V3.40. By now the version 5.1
is available. I'm not sure if the debug information is always
represented in the same way. This simulator doesn't support bank
linked applications as the new compiler and linker.
The simple OMF51-format knows only uppercase symbols. Because a symbol has no information about its type, the only known information is its address, but not its size and structure.
An absolute file will be opened with "file-open->selection". The source files must be located in the same directory as the absolute file. If not you must configure the path by hand in the workspace file under "SourcePath=..". This path is valid for all sources at once. Since version 2.04 you can load files also via drag-drop. The file will be read record by record. For each contained module (source file) an entry in the browser window is created. This entry has the name of the associated module. If the last modification date of a source file is newer than the absolute file, a warning is displayed. If for this reason the association between source file and line symbol cannot set correctly, the program may crash if you try to display in MIX-mode. Procedures which are defined inside a module will be displayed as sub entries below the module. Library procedures and code which is generated by the compiler will be displayed as a separate module with the name "LIB".
Load a HEX-File |
Sometimes it may be necessary to also load a hexfile. But this file doesn't contain symbol information. That means at reassembling also constants are translated to program code, what is nonsense. Nevertheless you can debug without symbol information. A hexfile can be loaded also before an absolute file. Then the code memory isn't cleared. Open a hexfile from menu with "file-open->selection". JSIM51 remembers if you load a hexfile before an absolute file and tries to load it again with the project at the next time. If the hexfile isn't found it will be removed from the workspace file. (You can do it by hand if you delete the key "hexfile=".)
| Notes for loading SDC51/ASxxxLink - Projects |
Saving the actual workspace |
All actual visible windows, watches, breakpoints etc. can be saved with "file-save as->selection". The file is saved in ASCII-format. The default name of this file is the name of the absolute file and the extension ".wsp". Nevertheless you have the opportunity to choose any name. This file contains all information to restore the actual settings. It could be edited by hand.
![]() But be careful. Many entries related to window
positions, IDs and docking state are very mysterious and depend from each
other. If the program crashes while loading it's recommendable to delete
or rename first this workspace file.
But be careful. Many entries related to window
positions, IDs and docking state are very mysterious and depend from each
other. If the program crashes while loading it's recommendable to delete
or rename first this workspace file.
The program starts then with its default settings. Watch expressions
or breakpoints can be taken from the corrupted WSP-file without risk.
At loading an absolute file (without the extension .wsp), the program
looks first for a matching wsp-file. If found it restores the display.
Note that code changes could cause that a breakpoint will become invalid.
Browser window and displaying the loaded code |
As start window the module which contains the symbol "main" will be searched and displayed. If this symbol is undefined, the code window from the reset address (0x0000) will be displayed. Normally (i.e. C-programs) this is the "LIB"-window and contains assembler code. Double click on a module or procedure in the browser window switches the actual code view to this program point. Each module owns its private window which will be activated if required or necessary. If the displayed program part is written in "C" (and the source file is available), the source text is displayed. Alternatively you can switch to the display modes Mixed(MIX) and Assembler(ASM). This can be done via menu or toolbar. If the source text isn't available or the code doesn't contain HLL information, the buttons "MIX" and "HLL" are disabled. Code areas which are not loaded via absolute file can be shown at assembler level. The input of the address must be done on the command input line ("d.p. address"). From this address the contents of the code memory is reassembled and displayed in a window named "UnKnown". To discern from loaded code the window has a different background colour. The view can be scrolled only forward. If the window will be closed and reopened, the code will be reassembled each time. (Maybe anybody builds self modifiable code.) The display can be switched alternatively from the command line if you enter an address or label.
![]() The state of the displayed modules (size, position, view mode)
will not be stored in the workspace file.
The state of the displayed modules (size, position, view mode)
will not be stored in the workspace file.
Examples:
| d.p.0x380 | - | shows code at address 0x380 |
| d.p.main | - | shows code at label "main" |
If no opcode is at the address, the cursor is set to the next HLL-line or assembler command, depending on the display mode.
Run the Code ... |
Operation can be done via keyboard or toolbar. The actual position of the program counter is marked with a yellow arrow. (The cursor is a grey arrow.) The consequence of the commands depends on the actual viewmode.
![]() Since version V2.00 a context menu can be opened in the code-window
with the right mouse button, containing frequently used commands.
Since version V2.00 a context menu can be opened in the code-window
with the right mouse button, containing frequently used commands.
| Step-In (F11): | |||
| Assembler- and Mixmode | - | Only one command will be executed. Is the command a "call" the jump into the procedure will be executed. | |
| HLL | - | One HLL-line will be executed. That means, assembler commands will be executed until the program counter reaches an address which is associated to a HLL-line. This could be the next following HLL-line or a line in another procedure/module. | |
Step-Over (F10): | |||
| Assembler- and Mixmode | - | If the assembler command is NOT a "call", Step-Over be effective the same as Step-In. The command is executed and the PC shows after that to the address of the next assembler command. If the command is a "call", to the address of the next command (after the call) a temporary breakpoint is set. The program is started in free run. If the breakpoint is reached, the program execution is stopped and the breakpoint will be deleted. In this manner many subroutines can be nested and the execution does not stop. Important to comply with that, the program doesn't stop if the command after the "call" is never reached. This could happen if inside the subroutine the stack will be changed and the return leads to another address. | |
| HLL | - | Contains the HLL-line no procedure call, then Step-Over causes the same as Step-In at HLL-level. If, inside of the line, a procedure is called, the program executes assembler commands till the program counter reaches a HLL-line in the same procedure. This condition will be checked after each instruction. Therefore such Step-Over is very slow. The reason, not to search the next instruction as at assembler code is e.g. the "goto" command. The target of the "goto" is unknown but normally not the next HLL-line. | |
Run-To-Cursor (F8): | |||
| Assembler-, Mix- and HLL-mode | - | To the address at the cursor line a temporary breakpoint is set. The program is started in free run. It runs till the next breakpoint. (This may be also another active breakpoint.) If the temporary breakpoint is reached, it is cleared and the program stops execution. | |
Run (F5): | |||
| Assembler-, Mix- and HLL-mode | - | The program starts without break condition. It executes as long as no break is reacted nor the user cancels execution via Stop. | |
Stop (F6): | |||
| Assembler-, Mix- and HLL-mode | - | The program execution is terminated immediately. The code window scrolls to the actual program counter. | |
Breakpoints |
Next to the internally administrated temporarily breakpoints, the user has the opportunity to set breakpoints at any location in the program. Breakpoints are marked with an red point in code window. They can be set, cleared (F9), or toggled (CTRL-F9) directly in this window. This is possible in all display modes. In Mixed mode a breakpoint is set on assembler instructions. Alternatively you can set breakpoints from the command input line. But the address must be a symbolic label. The reason is as follows: breakpoints are implemented by inserting an illegal opcode (0xA5) at the break address. If you have the possibility to set a break at any numeric address, you could change a data byte and not an op-code. The result may be fatally: The break would never be reached but your program may do any unpredictable actions.
![]() Since version 1.10 breakpoints are represented by an additional byte for
each byte in code memory. Even so the above description isn't changed.
Since version 1.10 breakpoints are represented by an additional byte for
each byte in code memory. Even so the above description isn't changed.
![]() Since version 2.00 you can set breakpoints also on memory access.
You can decide if on read, write or both.
This can be done in the following way:
Since version 2.00 you can set breakpoints also on memory access.
You can decide if on read, write or both.
This can be done in the following way:
| - | In the opened memory window (only possible in BYTE or ASCII view !!) | |||
| 1. | Select the interesting byte with click on the left mouse button. | |||
| 2.1 | With right mouse click open the context menu. Select the read, write or both. | |||
| 2.2 | ... or set it with CTRL-R (read-breakpoint) or CTRL-W (write breakpoint) | |||
| 3. | An active breakpoint is marked orange. (Breakpoints on program execution are not visible in the memory window.) | |||
| - | From the command line with this syntax: | |||
| b.s address(hex) access-type memory-range | ||||
Examples:
| b.s 0xF014 0x200 c | set a read access breakpoint to address 0xF14 in CODE-memory | |
| b.s 0x14 0x400 d | set a write access breakpoint to address 0x14 in DATA-memory | |
| b.s 0x95A 0x600 x | set a write+read access breakpoint to address 0x95A in XDATA-memory |
![]() Important!
Important!
If you set only one access breakpoint or change the default memory
configuration, then the simulation runs another, much slower path.
The reason is, each access must be checked now if it reaches a break.
This slows down the simulation by about 70-80% !!!.
The number of breakpoints doesn't affect the speed anymore,
if one is set.
Breakpoints can be deactivated. This is possible for the breakpoints at all, from menu with Edit-Breakpoints->Selection-Toggle or at the cursor position with CTRL-F9. Breakpoints are stored in the workspace file in their actual states.
Example:
| b.s.main | set breakpoint at address "main" |
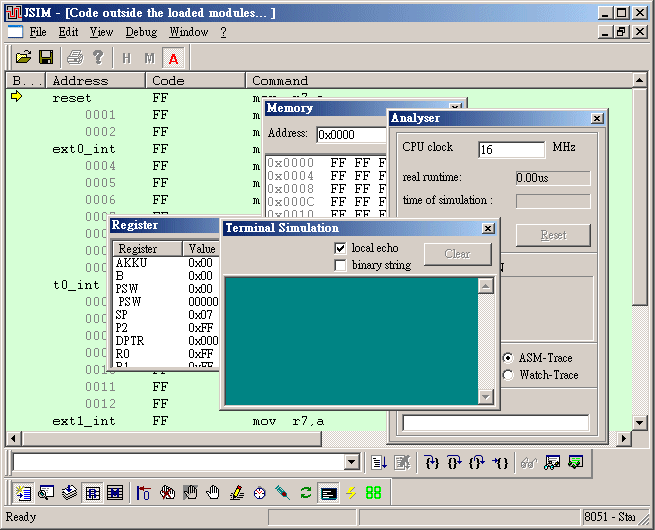
Register Window |
The register window will be opened from menu with "View-Register", via toolbar button, or from command line with "w.r". All important processor registers are displayed here and can be modified directly. Enter the new value and press "ENTER". If a register is changed while program execution, it is displayed in red after the next stop. On principle the window is updated after each program stop, after step, and if a value in another memory or watch window is changed.
![]() If the PC would be changed in the register window,
the code window doesn't switch immediately,
but first after the next step!
If the PC would be changed in the register window,
the code window doesn't switch immediately,
but first after the next step!
![]() The output of the register P2 can't be read back really.
The simulator assumes that in- and output of the register are the same.
Normally this should not disturb because this port isn't available
if external memory is used.
The output of the register P2 can't be read back really.
The simulator assumes that in- and output of the register are the same.
Normally this should not disturb because this port isn't available
if external memory is used.
Memory Window |
The memory window will be opened from menu "View-Memory".
Up to 10 memory windows can be opened at the same time.
This should be enough. Alternatively you can use the command line:
"w.m.viewmode.address /memoryspec".
The address can be entered as decimal or hexadecimal.
Also a label or a qualified C-expression is possible. That may cause
the contents where the window is pointed to, to change continuously.
Important: You must insert at least one space before "/" !
The viewmode is specified with the following characters:
a ASCII b byte s short (16 bit) l long (32 bit)
The memoryspec can have this values:
x XDATA c (default) CODE d DATA i IDATA p PDATA
(If P2 is changed, the region where the
window is pointed to is also changed.)
Examples:
0x1F00 /x - Xdata from 0x1F00 20 /d - Data from 0x14 testarray - Memory at symbol "testarray" *xptr+2 /c - Code from the content of the pointer xptr.
Such an expression can be used only if OMF51-Ext was loaded.
Otherwise you don't know the type of the pointer and its referenced memory.MAIN - Code memory at symbol MAIN
Click with the right mouse button opens a context menu for the view modes:
Byte Short Long ASCII
In all modes you can change the values directly. To do this, click at the entry and enter the new value. The value is assumed as hexadecimal value. In ASCII-mode the keyboard code will be entered. Confirm with "ENTER". Is the input valid then the new value will be written into memory. Memory contents which were changed since the last window update will be displayed red. So also at step through a program which changes the currently displayed memory region.
Copy and Paste in Memory Window |
It's possible to change a memory region all at once with Copy-Paste. To enter a string the view mode must be ASCII. Select the cell from where the string should be written. The string is inserted as usual with Ctrl-V, SHIFT-Insert or via context menu. The closing zero is also copied! Should be inserted binary values the view mode must be BYTE and the string must be written in this form: "01 dd E5 77 00 FF". The procedure is the same as for ASCII strings.
Watch Window |
JSIM51 offers powerful possibilities to display not only the values of any variables but also the evaluation of complex C-expressions. There are different ways to display values of variables and expressions:
Tooltip |
Simply hold the mouse pointer over the name of a variable or mark it with double click. After a short time the actual value is displayed. If it is a built-in C data type the value is shown. If it is a pointer, the memory space where it is pointed to and its value is shown. In case of a complex type, e.g. a structure, its start address and memoryspace is displayed in braces. If the label is unknown the tooltip doesn't appear.
![]() This kind of displaying variables looks for a local variable with the
selected name, i.e. the variable name will be expanded to the form
module:procedure:variable-name.
To get the module and procedure the actual cursor position is used.
If the cursor is outside of code (e.g. on a declaration), the first
variable with this name in the displayed module is searched and displayed.
This is, if present, the global variable or any other local symbol
with this name.
This kind of displaying variables looks for a local variable with the
selected name, i.e. the variable name will be expanded to the form
module:procedure:variable-name.
To get the module and procedure the actual cursor position is used.
If the cursor is outside of code (e.g. on a declaration), the first
variable with this name in the displayed module is searched and displayed.
This is, if present, the global variable or any other local symbol
with this name.
Tooltip on marked text |
If the expression is more complex (e.g. testval[ x ]), select it with the mouse and set the mouse pointer on the selected text. The display is as above, only with the important difference that the name isn't expanded!
Temporary Watch Dialog |
The representation by tooltips allows only simple data types. If you want to see a structure or the content of a pointer open a temporary watch window. Select an expression and press SHIFT-F9. The structure will be displayed as a tree. Elements which have a "+" can be opened furthermore with click on that symbol. Simple data types and pointers can be edited directly. Enter the new value and confirm with "ENTER". If you want to take the expression into the permanent watch window, click on: "Add to Watchwindow".
Permanent Watch Window |
The watch window can be opened with "View-Watch" from toolbar or alternatively from the command line with "w.w". A new watch expression is entered either from the temporary watch dialog or directly in the lower empty line. Spaces in an expression are allowed. If the expression is valid, it will be evaluated and displayed. On the other hand a failure message is displayed. (Note, an invalid expression must not always stay invalid, e.g. generic pointers by Keil-C51.) You can edit an expression. Confirm always with "ENTER". Remove an entry by clearing the field and "ENTER". If a tree is opened, the entries below are also removed. To differ global and local symbols, you can additionally enter module name and procedure name.
Examples of watch expressions:
| x | - | the variable x. if more than one variable exists with this name, it is either the global one, or the first local variable found (ambiguous). | |
| _UP1:x | - | the local variable x, defined in procedure UP1 | |
| sisa[4].perfdat->BERcnt[x-1] | - | a complex expression which can contain more than one variable | |
| {0x0200,x} | - | the contents of the memory cell 0x200 in XDATA memory, displayed as byte. (The address can be entered only hexadecimal.) This is not a valid C-expression, but it can't be mixed up, and allows to display the content of memory cells. |
The display of the evaluated expressions is the same as in the temporary watch dialog.
Examples:
| {XD: 0x3450} | - | The address of a complex data type (not editable but mostly it can be opened) | |
| {-> D: 0x55} | - | Pointer to the address 0x55 in the data memory (can be edited and opened) | |
| 0x42 "Beta" | - | A simple character (signed char). To make a string more readable, the C string from this address till the first 0 is displayed. (Only the first character can be edited.) | |
| 0x61 | - | An unsigned char (editable) | |
| 0x1234 | - | short (editable) |
You can open a context menu with the right mouse button. From there the display can be changed between decimal and hexadecimal. The binary representation is only possible for the CHAR and UCHAR types. The actual settings are stored in the workspace. A window update will be done after each code step or a change in a memory- or register window.
![]() OMF-51 doesn't know anything about PDATA variables.
That means a variable declared in PDATA
appears in the watch window as an XDATA symbol. This may be correct as
long as you don't change register P2. To solve this problem open a context
menu (left column, unselected text !!). Then you can change the memory space
between XDATA and PDATA. Also possible from the command line with
"c.p smybolname" change to PDATA or
"c.x smybolname" change to XDATA.
After that, the watch follows the register P2.
This setting will not be saved in the workspace.
OMF-51 doesn't know anything about PDATA variables.
That means a variable declared in PDATA
appears in the watch window as an XDATA symbol. This may be correct as
long as you don't change register P2. To solve this problem open a context
menu (left column, unselected text !!). Then you can change the memory space
between XDATA and PDATA. Also possible from the command line with
"c.p smybolname" change to PDATA or
"c.x smybolname" change to XDATA.
After that, the watch follows the register P2.
This setting will not be saved in the workspace.
Data Types without "OBJECTEXTEND" |
If an object file wasn't built with the option "OBJECTEXTEND", no information about the types of all symbols is available. None of the comfortable possibilities to display complex types described above are available. To make debugging more easy nevertheless, you can assign a simple data type to a symbol. At first insert the symbol in the watch window. Then set the mouse pointer on this field and open with the right button the type assign dialog. The following types can be assigned:
signed char unsigned char signed short unsigned short signed long unsigned long float Pointer to data types which were defined before in any memory space
(The generic Keil-C51-pointers are not supported in this mode. If you want to use it, compile your sources with the option "OBJEXTENDED".) A type can be changed at any time while debugging but it won't be stored in the workspace file. This opportunity to manipulate the data types is only available if the absolute file doesn't contain the extended object file format, i.e. if all modules were compiled without "OBJECTEXTEND".
Locals |
A very comfortable service as at MS-Visual-C++. The window always shows all local variables of the actual procedure. That means the displayed variables change each time if the procedure is changed as result of a call or return. Open this window from menu with "View-Locals", from toolbar, or alternatively from command line with "w.l". You can't enter additional entries into this window, but you can edit the displayed variables.
Breakpoint Window |
The breakpoint window will be opened from menu with "Edit-Breakpoints". It shows all actual set breakpoints. A breakpoint can be deleted, activated or deactivated here. Inactive breakpoints are displayed with a red circle, active with a red point. Memory access breakpoints (since version 2.00) are marked with an orange square. They can only be deleted, but not deactivated.
Memory Configuration Window |
This window will be opened from menu with "Edit-Memory configuration". Here you can define the memory regions which are apparently available to a program. Any segmentations are possible. In this way it's possible to detect an access in regions that are not available later on the target hardware. Note that any changes in the default memory configuration will have consequences to the simulation speed which slows down if the memory access must be checked.
Analyser Window |
The analyser offers some options to measure the runtime of a program and to configure the trace. The processor clock defines the oscillator frequency of the simulated target. The time in the window "real runtime" is depending from this value. A reduction of the value immediately causes an increase of the runtime. The value of "simulation time" is more informative. It is depending from the trace options and the computer where the program runs. "Autostart" causes a reset of the cycle counter at each Step, Step-Over, Run etc. In this way it's possible to measure the runtime for single C-instructions till single assembler commands. If "Autostart" isn't set, the periods will be accumulated. The counters can be cleared with "Reset counter". The calculation of the simulation time will be done only if "Autostart" is set. If you need information about the maximal, average and minimal runtime of a program part (perhaps at loops over different paths), you can set a measure point. It must be enabled in the analyser window ("measure point ON"). Every time when the point is reached, the value of the actual cycle counter will be stored. The cycle counter is cleared on each (also inactive!) breakpoint. Configure a measure as follows:
When the last breakpoint is reached, the number of measures, the shortest, the average and the longest runtime of the loop is displayed.
There are two kinds to write the trace:
The trace recording will be started with "Enable Trace". It will be written into the file "temptrace.log". This file stores the instruction trace in binary format, the variable-trace in ASCII format. To view the recorded trace use the trace view window. This window is opened from menu with "View-Trace", from toolbar or alternatively from command line with "w.t". The length of the trace is limited to 1000 entries. If this value is reached, the file will be written from the beginning again. The trace window is only available if "Enable Trace" is set to off.
Stimulation File |
New since version 3.01 is the possibility to set a so called stimulation point. That means, while your program is running, each time when this point will be reached, a line from a script will be read and entered in the command line. The script file is a normal text file which can contain all valid commands for the command line. Multiple commands must be separated with commas. The meaning of such a stimulation file is for example to simulate changes on port pins. An example could be like this:
| $m.d 0x20 0x05 , s.d 0x22 0xAA | set DATA memory at address 0x20 to 5 and at addresses 0x22 to 0xAA | |
| $m.x 0x1000 0xAB | set XDATA-cell 0x1000 to 0xAB | |
| w.m.l 0x9F0 /x | opens a memory window | |
| b.s 0x3400 | set a breakpoint to address 0x3400 |
When the end of file is reached, it starts again from the beginning. A stimulation point can be set via the command line or from the toolbar. The stimulation point and also the path of the stimulation file will be stored in the workspace.
Interrupt Window |
The program cannot fully simulate the peripheral hardware of the controller. Since DLL-version 1.011 the timers are supported, but the serial interface is only present in a functional way (problem baudrate). Nevertheless actions which are triggered by interrupts should be testable. For that serves the interrupt window. It allows to configure and generate the five standard interrupts of the 8051. The serial interrupt will be treated separately for receive and transmit. To cause an interrupt, it must be enabled and the global interrupt enable bit must be set. It's also possible to generate several interrupts simultaneously. The simulator should process each interrupt as configured via the priority. A present but not yet processed interrupt is recognizable by the activated interrupt button. The simulator resets it automatically after its acceptance. (Exception: the flags RI and TI of the serial interrupt, which must be cleared by the program itself.) The window is updated after each stop, step etc. Changes of interrupt settings will be visible first after the next stop!
Stack Window |
The stack window shows the depth of the procedure calls. At each call or also at interrupt acceptance an entry is inserted on top of the list. It shows the actual procedure and the address from where it is called. With double click you can switch the view to the call address. This may be problematically if the stack pointer or its content will be changed by the program. The stack window tries to follow such actions, but its not so difficult to confuse it. You must be careful with the displayed content, if you use POP and PUSH in the program. On overrun of the stack pointer a warning message is generated, but you can continue with the program.
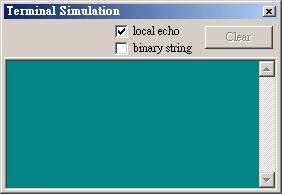
Terminal Window |
 Often programs for serial communication have to be developed.
As a result of this I made a restricted exception concerning the hardware
simulation. But only qualitative. The time relations are not correctly
realised. The baudrate has no meaning. The proper initialisation of the
timer isn't checked. The terminal window will be opened from menu with
"View-Terminal" or from command line with
"w.c". The terminal window simulates a receive
interrupt if a character is entered. In the other direction it simulates
a transmit interrupt if the register S0BUF is changed. Only a transmission
of 8-bit width is possible. The start of the terminal window slows down
the simulation a bit, because it uses its own thread. It should be opened
only if it is really required. The option "local echo"
makes that every entered character is displayed directly in the window.
If the option is off, all characters will be written into S0BUF and,
if enabled (ES=1 in IE0 and REN=1 in S0CON), the serial interrupt will
be set (RI=1 in S0CON). If you want to display binary characters, the
option "binary string" must be on. Then a received string
has the format: 00 02 09 41 FF ... etc. The input must be done in the same
form. All characters, which are no hexadecimal numbers, are ignored,
except backspace.
Often programs for serial communication have to be developed.
As a result of this I made a restricted exception concerning the hardware
simulation. But only qualitative. The time relations are not correctly
realised. The baudrate has no meaning. The proper initialisation of the
timer isn't checked. The terminal window will be opened from menu with
"View-Terminal" or from command line with
"w.c". The terminal window simulates a receive
interrupt if a character is entered. In the other direction it simulates
a transmit interrupt if the register S0BUF is changed. Only a transmission
of 8-bit width is possible. The start of the terminal window slows down
the simulation a bit, because it uses its own thread. It should be opened
only if it is really required. The option "local echo"
makes that every entered character is displayed directly in the window.
If the option is off, all characters will be written into S0BUF and,
if enabled (ES=1 in IE0 and REN=1 in S0CON), the serial interrupt will
be set (RI=1 in S0CON). If you want to display binary characters, the
option "binary string" must be on. Then a received string
has the format: 00 02 09 41 FF ... etc. The input must be done in the same
form. All characters, which are no hexadecimal numbers, are ignored,
except backspace.
![]() You cannot send strings with copy-paste to the terminal window.
I don't know how I should handle this. The terminal window needs
to wait that the interrupt has processed a character.
But this doesn't reflect the real behavior and you are in danger
to test something to "good".
You cannot send strings with copy-paste to the terminal window.
I don't know how I should handle this. The terminal window needs
to wait that the interrupt has processed a character.
But this doesn't reflect the real behavior and you are in danger
to test something to "good".
Notes for loading SDC51/ASxxxLink - Projects |
In contrast to other compilers/linkers SDC51/ASxxxLink doesn't produce only one absolute object file. The symbol type informations are stored separately for each HLL-module in a symbol-type-definition file (.cdb), and the addresses and line numbers in the mapfile (.map). The object code is in the .ihx-file (an ordinary Intel-hexfile). So if you want to debug on C-level, you need all the following files in the same directory:
To load the project open the .ihx-file.
JSIM knows than that you want to load an SDC51 project and searches
next for the map file (.map)
with the same name as the hexfile
(!) and then for the .cdb- and source files.
The sources must be compiled with the option --debug.
Each source must be built separately and at last step they will be linked all together.
Here is a short example:
..\bin\sdcc -c --debug mod1.c
..\bin\asx8051 -olj aprog.a51
..\bin\sdcc -c --debug main.c
..\bin\sdcc -Wl-mjkC:\sdcc\sdcc51lib main.rel aprog.rel mod1.rel
There are some restrictions which are caused by the SDC51-compiler:
| It may be a good idea to use JFE
as program editor. If you use the compiler filter "MS C/C++", you can compile with SDCC and jump directly to the errors and warnings! |
| The author: Jens Altmann Dresden, Germany |
 | |
| Jens.Altmann@t-online.de | ||
Last revised: W.W. Heinz, April 10, 2022